Bayesian Networks Explained: Tackling Uncertainty in Decision-Making
Table of Contents
Every day, we make decisions under uncertain conditions—whether it’s predicting the weather or making financial choices. Bayesian Networks help model these uncertainties, offering a structured way to handle complex decision-making. Don’t worry if terms like “conditional probability” sound challenging. This guide will simplify Bayesian Networks, so you’ll understand how they work in real-world applications.

Introduction
In a Bayesian Network, variables are represented as nodes, and directed edges between the nodes indicate conditional dependencies. Each node is associated with a Conditional Probability Table (CPT), which quantifies the likelihood of a node’s value given the values of its parent nodes. This structure allows BNs to efficiently compute the joint probability distribution for any combination of variables, making them a powerful tool for decision-making in uncertain environments.
Problem Statement
Traditional approaches struggle with the uncertainty and interconnectedness of the variables affecting demand. How can we effectively model and predict the demand for perishable goods in the face of such uncertainty?
The problem we aim to solve is:
How can we use probabilistic reasoning to predict demand for perishable goods by accounting for multiple uncertain factors like weather, holidays, and economic trends?
The goal is to build a knowledge-based agent that can successfully navigate the grid from the start to the goal, avoiding obstacles, by reasoning about the environment based on its sensory inputs.
How Bayesian Networks Solve the Problem
Bayesian Networks (BNs) offer a structured way to represent uncertainty and interdependencies among various factors. In the context of supply chain management, we can model demand prediction using a BN where:
- Nodes represent factors such as weather conditions (rainy, sunny), holidays (festive season, regular days), and economic conditions (strong, weak).
- Edges capture the probabilistic relationships between these factors and demand. For example, a holiday season might increase demand, while bad weather might decrease it.
Each node is associated with a Conditional Probability Table (CPT), which provides the likelihood of that node’s state based on its parent nodes. For instance, the CPT for demand might tell us how likely high demand is given that it’s a holiday and the weather is sunny.
Bayesian Networks allow us to calculate the probability of different levels of demand based on observed conditions. This enables companies to make informed decisions about inventory management, reducing waste and avoiding shortages.
Step-by-Step Application of Bayesian Networks
The goal is to predict demand for perishable goods based on uncertain factors like weather and holidays.
1. Identify Random Variables
The first step is to identify the key factors (random variables) involved in predicting demand for perishable goods. In our example, these are:
- Weather: Can be
SunnyorRainy - Holiday: Can be
HolidayorNoHoliday - Demand: Can be
HighorLow
These are the variables that will form the nodes of our Bayesian Network.
2. Define Relationships and Conditional Dependencies
Next, we define how these variables are interrelated:
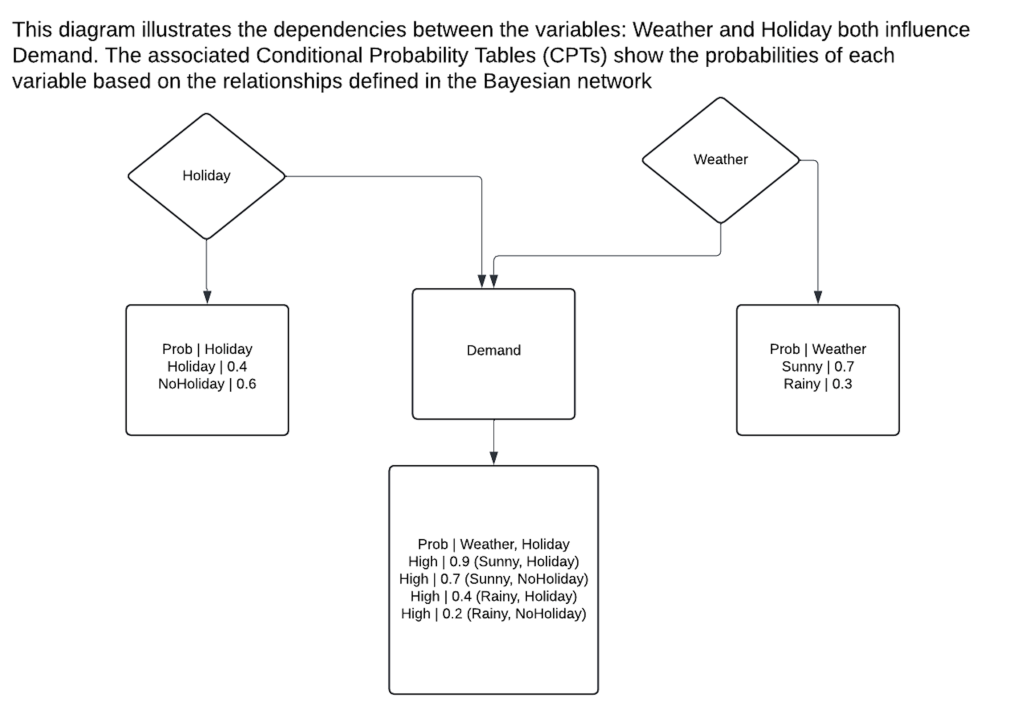
- Weather and Holiday influence Demand. If it’s sunny and a holiday, demand is likely to be high. If it’s rainy or not a holiday, demand might be low.
- The dependencies in the network are represented as directed edges:
- Weather → Demand
- Holiday → Demand
This structure shows that Demand is conditionally dependent on Weather and Holiday.
3. Construct the Conditional Probability Tables (CPTs)
We now create Conditional Probability Tables (CPTs) to represent the probabilistic relationships between the variables.
- Weather (no parents, so prior probabilities):
\(P(Weather = Sunny)\) = 0.7, \(\quad P(Weather = Rainy)\) = 0.3 - Holiday (no parents, so prior probabilities):
\(P(Holiday = NoHoliday)\) = 0.6, \(\quad P(Holiday = Holiday)\) = 0.4
- Demand (depends on Weather and Holiday):
\(P(Demand = High | Weather, Holiday)\) =\begin{cases}
0.9 & \text{if Weather = Sunny and Holiday = Holiday} \\
0.7 & \text{if Weather = Sunny and Holiday = NoHoliday} \\
0.4 & \text{if Weather = Rainy and Holiday = Holiday} \\
0.2 & \text{if Weather = Rainy and Holiday = NoHoliday}
\end{cases}\(P(Demand = Low | Weather, Holiday)\) = \(1 – P(Demand = High | Weather, Holiday)\)
- Weather (no parents, so prior probabilities):
4. Input Observed Evidence
Once the CPTs are in place, we use the Bayesian Network to compute the probability of demand based on observed evidence. Suppose we observe that the Weather is Sunny and it is a Holiday. We want to calculate the probability of High Demand.
5. Apply Bayes’ Rule
Using the observed evidence, we apply Bayes’ rule to compute the probability of high demand. Since the variables are interconnected, we compute the joint probabilities and normalize them:
- Step 1: Compute the joint probability of the evidence (e.g.,
Weather = SunnyandHoliday = Holiday) and the query (Demand = High).\(P(Demand = High, Weather = Sunny, Holiday = Holiday)\) =
\(P(Demand = High \, | \, Weather = Sunny, Holiday = Holiday)\) \(\times P(Weather = Sunny) \times P(Holiday = Holiday)\)
Plugging in the values:
\(P(Demand = High, Weather = Sunny, Holiday = Holiday)\) = 0.9 \(\times 0.7 \times 0.4 = 0.252\)
- Step 2: Compute the joint probability of the evidence and low
\(P(Demand = Low, Weather = Sunny, Holiday = Holiday)\) =
\(P(Demand = Low | Weather = Sunny, Holiday = Holiday)\) \(\times P(Weather = Sunny)\) \(\times P(Holiday = Holiday)\)
Using
\(P(Demand = Low, Weather = Sunny, Holiday = Holiday)\) = \(0.1 \times 0.7 \times 0.4 = 0.028\)
- Step 3: Normalize the results to find the final probability distribution for demand.
\(P(Demand = High | Weather = Sunny, Holiday = Holiday)\) =
\[\frac{P(Demand = High, Weather = Sunny, Holiday = Holiday)}{P(Demand = High, Weather = Sunny, Holiday = Holiday) + P(Demand = Low, Weather = Sunny, Holiday = Holiday)}\]
\(P(Demand = High | Weather = Sunny, Holiday = Holiday)\) = \(\frac{0.252}{0.252 + 0.028} = 0.9\)
Thus, given that the weather is sunny and it’s a holiday, there is a 90% chance of high demand.
Program Example
Here’s a simple Python example using pgmpy, a library for probabilistic graphical models, to demonstrate how a Bayesian Network can be applied to supply chain demand prediction.
from pgmpy.models import BayesianNetwork
from pgmpy.factors.discrete import TabularCPD
from pgmpy.inference import VariableElimination

# Define the structure of the Bayesian Network
model = BayesianNetwork([('Weather', 'Demand'), ('Holiday', 'Demand')])

# Define the Conditional Probability Tables (CPTs)
cpd_weather = TabularCPD(variable='Weather', variable_card=2, values=[[0.7], [0.3]],
          state_names={'Weather': ['Sunny', 'Rainy']})

cpd_holiday = TabularCPD(variable='Holiday', variable_card=2, values=[[0.6], [0.4]],
          state_names={'Holiday': ['NoHoliday', 'Holiday']})

cpd_demand = TabularCPD(variable='Demand'<, variable_card=2,
                values=[[0.9, 0.7, 0.4, 0.2],
                [0.1, 0.3, 0.6, 0.8]],
                evidence=['Weather', 'Holiday'],
                evidence_card=[2, 2],
                state_names={'Demand': ['Low', 'High'], 'Weather': ['Sunny', 'Rainy'],
                         'Holiday': ['NoHoliday', 'Holiday']})

# Add the CPDs to the model
model.add_cpds(cpd_weather, cpd_holiday, cpd_demand)

# Verify the model
assert model.check_model()

# Perform inference
inference = VariableElimination(model)

# Query the probability of high demand given it is sunny and a holiday
result = inference.query(variables=['Demand'], evidence={'Weather': 'Sunny', 'Holiday': 'Holiday'})

print(result)
This program will output the probability distribution for demand being low or high, given that it is sunny and a holiday. For example:
+———+————-+
| Demand | phi(Demand)|
+———+————-+
| Low | 0.2 |
| High | 0.8 |
+———+————-+
This program will output the probability distribution for demand being low or high, given that it is sunny and a holiday. For example:
Conclusion
Bayesian Networks provide a powerful way to model uncertainty in complex systems like supply chain management. By incorporating various probabilistic factors such as weather, holidays, and economic conditions, BNs enable businesses to make data-driven decisions and optimize inventory levels, reducing waste and preventing stockouts.
With the use of BNs, we can represent and compute the probabilities of different outcomes, allowing decision-makers to act on the most likely scenarios based on observed evidence.
As the Tech Co-Founder at Yugensys, I’m driven by a deep belief that technology is most powerful when it creates real, measurable impact.
At Yugensys, I lead our efforts in engineering intelligence into every layer of software development — from concept to code, and from data to decision.
With a focus on AI-driven innovation, product engineering, and digital transformation, my work revolves around helping global enterprises and startups accelerate growth through technology that truly performs.
Over the years, I’ve had the privilege of building and scaling teams that don’t just develop products — they craft solutions with purpose, precision, and performance.Our mission is simple yet bold: to turn ideas into intelligent systems that shape the future.
If you’re looking to extend your engineering capabilities or explore how AI and modern software architecture can amplify your business outcomes, let’s connect.At Yugensys, we build technology that doesn’t just adapt to change — it drives it.
Subscrible For Weekly Industry Updates and Yugensys Expert written Blogs


